Third party data imports
Third-party data imports identify the correlation between pressure events and operational activity

provides enhanced network intelligence
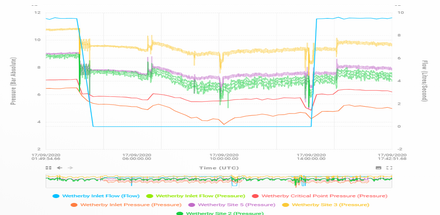
The observed pressure at any point in a pipeline is determined by several factors:
When comparing measurements made at multiple points on the network, the total head differences can easily dominate and mask more subtle information like flow head loss or transient wave attenuation.
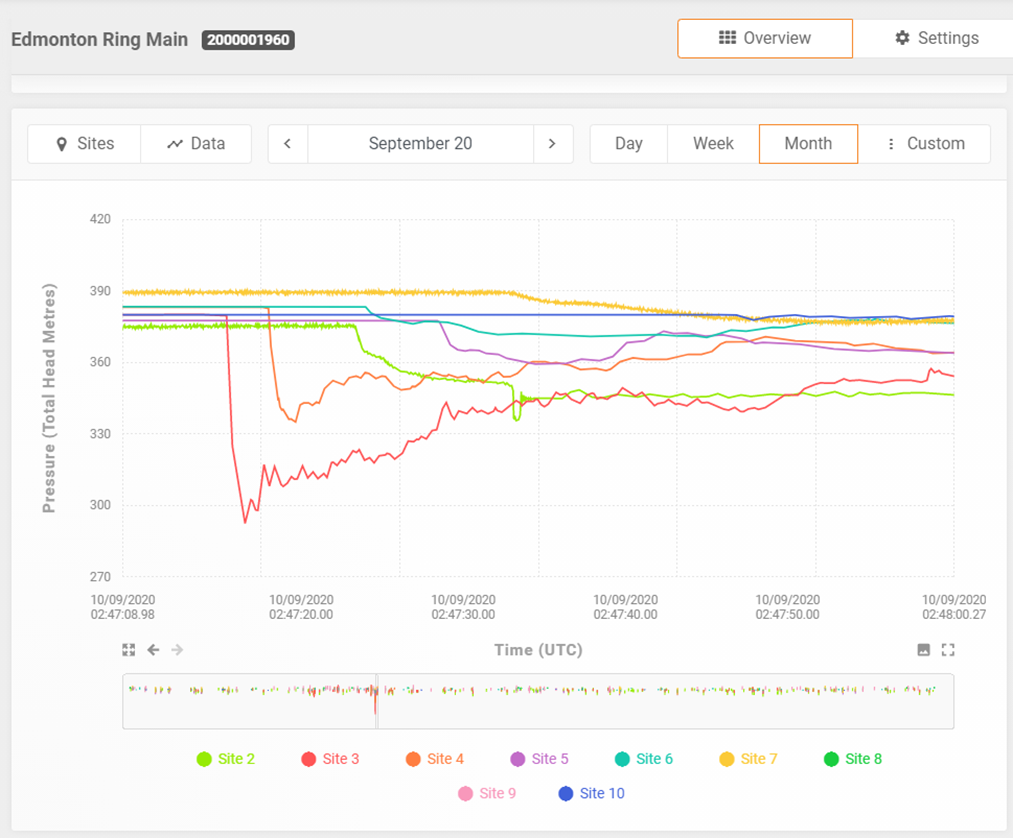
RADAR features a 'Total Head Pressure View'.
This removes the effect of the static head from the pressure display, allowing a much clearer comparison of flow head loss and pressure transient events from multiple sites.
The Total Head Pressure View feature is useful for clients with more than one PIPEMINDER monitoring device in the same pressure zone and adjustments can easily be made and displayed.
Static head adjustment makes it easier for users to display the data in a way that they want, without having to export the data from RADAR and manually offset the pressure from each monitoring point by the elevation of that site.
Pressure data across a drinking water network could vary from 2 to 25 bar or more. In order to show a bit range of pressure data, the Y-axis needs to be stretched, which results in a decrease in the resolution of changes across the same axis.
As the total head should be roughly the same at all points in a DMA which does not have pressure regulating assets, pressure data “squeezes” and allows variations in the Y-axis to be visualised better.
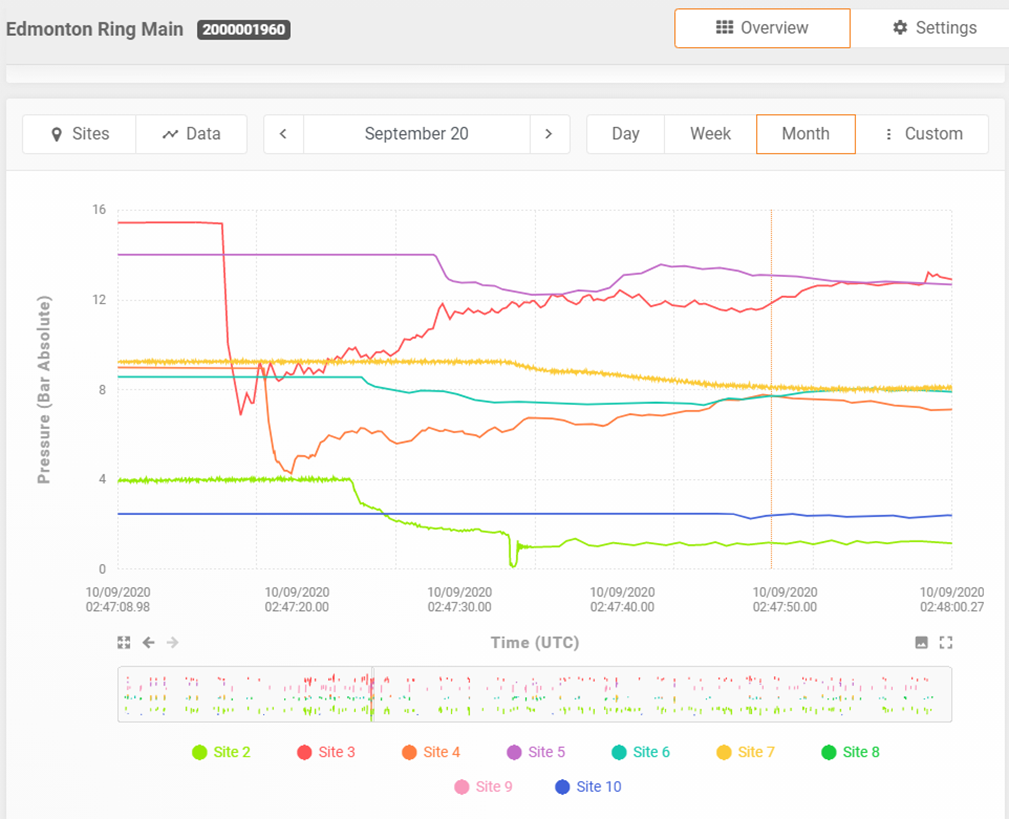
As an example, one can see head loss due to moving of water in a direction, reduction/increase of pressure due to valve operation, etc
This feature was developed following a request from Cobb County Marietta Water Authority who asked if static head could be removed from the pressure display so that flow headloss and transients can be more easily compared.
Adjusting and adding site elevation to accommodate pressure changes give utilities a much better understanding of how their network is functioning.
With advanced insights, utilities can make better decisions about their operations, decisions that save time and money by reducing leaks and bursts and extending the life of equipment and infrastructure.
For more information about how to best use your Total Head Adjustment feature, contact your Syrinix support team
Third-party data imports identify the correlation between pressure events and operational activity
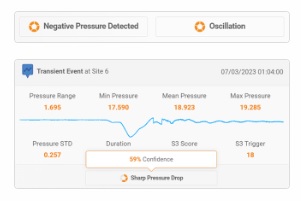
Newly detected transient events are run through multiple levels of data analysis to identify features in the event data.
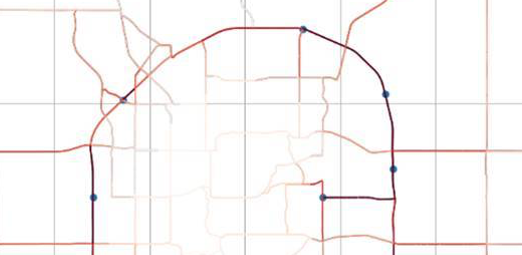
Deployment Planning allows utility engineers to optimize where units should be deployed