Learn about the new leakage reporting features that go hand in hand with PIPEMINDER-ONE Acoustic
Change country
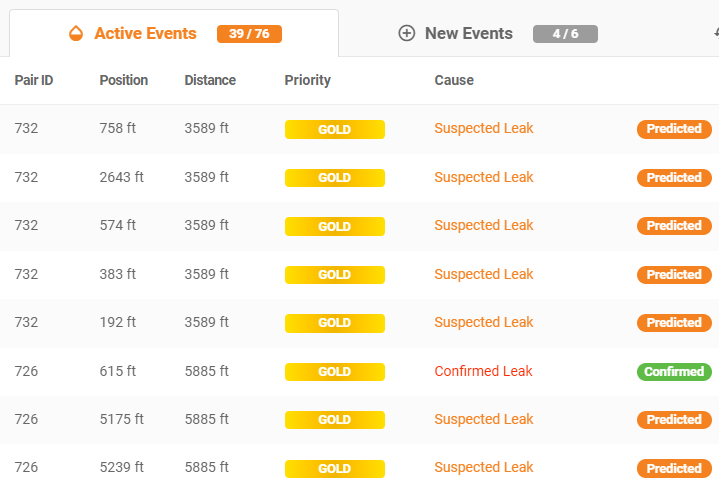
Potential leak noise events are aggregated into an events table with various tabs and filters to help view, manage and prioritise new and ongoing events.
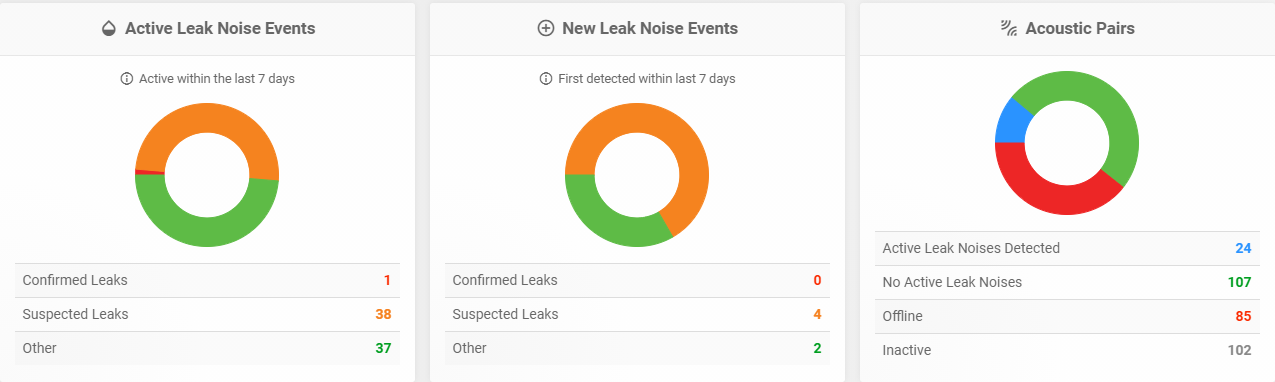
Events are categorised into one of three categories based on the cause of the event:
Confirmed leaks - these are events that have been alerted and subsequently verified/confirmed as being a leak noise source by a user.
Suspected leaks - these are events that have either been alerted initially as a suspected leak noise source, or that have been subsequently confirmed as a suspected leak by a user.
Other - these are events that present characteristics of being caused by non-leak sources, such as out of bracket noise, or being in the location of a known pipe feature such as a sharp bend.
Filtered events are displayed on the map with coloured flag markers matching the noise source cause – red for confirmed leak noises, orange for suspected leak noises, and green for all other causes.