Monitoring pressure transients reduce main breaks at East Valley Water District
Change country
When it comes to maintaining consistent pressure levels in municipal water systems, consistency is the name of the game.
Pressure transients can have a serious impact on both service quality and asset life and the challenge is pinpointing the source of any transients in a timely manner to mitigate the destructive effects
That was the situation facing East Valley Water District (EVWD), which provides water and wastewater services to 103,000 residents of San Bernardino County.
Pressure transients, aging assets, bedding failures, and corrosion are all potential contributing factors to observed line breaks.

Utility staff felt evaluating the existence and severity of pressure transients was an effective and prudent step in actively managing its water distribution system to reduce line breaks.
With the cost of repairing a single break ranging from $10,000 to $25,000, reducing these events can generate significant savings.
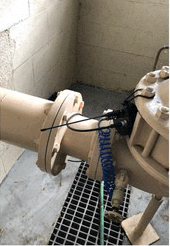
EVWD undertook a water network calming project aimed at identifying transient activity that could harm the system. The District partnered with Syrinix to design a pressure monitoring project using PIPEMINDER-ONE pressure monitors.
PIPEMINDER-ONE combines accurate pressure monitoring at 128 samples per second with network-synced time stamping, enabling high-resolution transient event detection including source locating. Data is sent via cellular networks to the RADAR cloud platform for analysis.

The question was where to monitor to get the greatest return on efforts?
To identify critical areas, the Syrinix team imported EVWD’s historical data on breaks and combined this with geographic information system (GIS) using QGIS software to create a map of “hot spots” of concern associated with specific pressure zones. Possible transient sources—such as pumps, valves, and users—were then identified near each hot spot.
Using this water main break heat map, pressure monitors were deployed at pumping stations and on hydrants across the network to confirm transient propagation across the monitoring area.
At this moment, a challenge emerged: California’s lockdown due to the COVID-19 pandemic. The EVWD team adapted to safely deploy the monitors in compliance with work guidelines issued by the state of California.
To cover the entire service area, the monitoring project was undertaken in phases, focusing on the most critical areas on the heat map first.
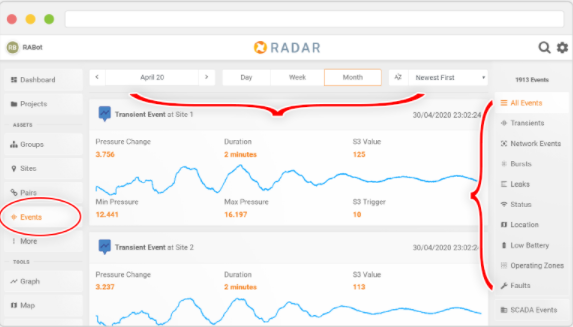
To identify transients of concern, two types of data were analyzed:
• Summary pressure data. This is a summary of the minimum, mean, and maximum pressure values registered over a period of 1 or 15 minutes based on constant readings at 128 samples a second, also known as high-sample-rate data.
• Pressure sensitivity data. A pressure sensitivity level, known as an S3 score, was set in each pressure monitor to alert when transient events occur. S3 scores are a non-dimensional measure of pressure transient activity calculated within the unit itself
Large and sudden changes result in a high score; small changes over a longer period resulting in a lower score. Tracking and profiling pressure sensitivity data is a good measure of the pipeline’s transient activity, indicating if the activity level has increased or if mitigation work has been successful in reducing it.
The collected pressure data was analyzed to identify the root source of the transients via triangulation. First, similar transient wave shapes from all monitored sites were grouped to identify clusters of recurrent transient events produced by different sources.
The analysis then focused on identifying the source of those events. Locations of automatic triangulation results were plotted on the water main break heat map and matched with the transient clusters previously identified, pinpointing the source of the recurrent transient event.
During the first phase of monitoring, the analysis found that the aggressive starts and stops of a specific pump station created transient events that added additional stress to the pipeline network. The insights revealed by the analysis enabled EVWD to identify the specific assets which produced these transients and take action to mitigate the transients and calm the flow.
![]()
One benefit of the high-resolution monitoring is that it identifies smaller, more frequent transient “noise” that can, over time, cause significant wear and tear on pipes and other assets. These can often be mitigated more quickly and less expensively than larger transient situations, improving the overall network health.
Based on this success, EVWD has now initiated a process of relocating the monitors to different locations on a rotating basis to provide ongoing analysis of hot spots throughout its service area. EVWD continues to monitor trouble spots, line break events, and customer pressure concerns to assess the results of the calming.
With thousands of assets spread over a wide geographic area, EVWD now has actionable data to guide its troubleshooting and network optimization efforts.
Before the monitoring project, when customers reported pressure concerns, EVWD had no definitive way to determine if the problem was within the agency’s network or not. Now, with high-resolution monitoring, EVWD bases its actions on actual data-led insights.
This Case Study was published in the March 21 edition of WaterWorld magazine