Automated Transient Labelling
Newly detected transient events are run through multiple levels of data analysis to identify and label features in the event data.

With high-resolution data from their water networks, utilities gain insight that helps them make changes to their operations. Using those high-resolution insights, operational adjustments can calm networks, reducing stress and aging on valuable pipeline assets. They can also mitigate the disastrous results of major pipes bursting in built up areas.
One way of visualizing those high-resolution insights is through Syrinix heat mapping, an analysis tools that provides visual information using colors on an image or map. Like a bar graph that uses height and width to visualize data, heat maps use color intensity to visualize the geographic density of event data.
Heat mapping is used to show a utility where they have leak/burst hotspots and to analyze historic information such as the intensity of leaks and bursts across networks and even, with the right data, highlighting specific types of burst hotspots. This analysis is based on looking at leak/burst data over the previous two or three years and is colored red on the heat map.
Heat mapping is also used to identify the source of damaging pressure events including locating bursts. This is done on an on-going basis driven by the data captured by PIPEMINDER units. With this information, Syrinix triangulation – a benefit of high-frequency monitoring combined with clock accuracy - shows where a transient originates. This valuable information empowers a utility to deploy resources to address the culprit. A pump station is often the source of transient activity as was the case with a client on the USA West Coast. There, the utility removed a significant amount of transient activity using heat mapping to identify a problem-causing pump. And in the UK recently, when a client had two major bursts it was Syrinix technology that provided the first alert saving valuable time when every minute mattered. The utility was also able to much more quickly identify which pipe had failed.
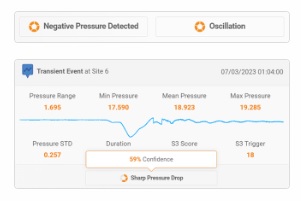
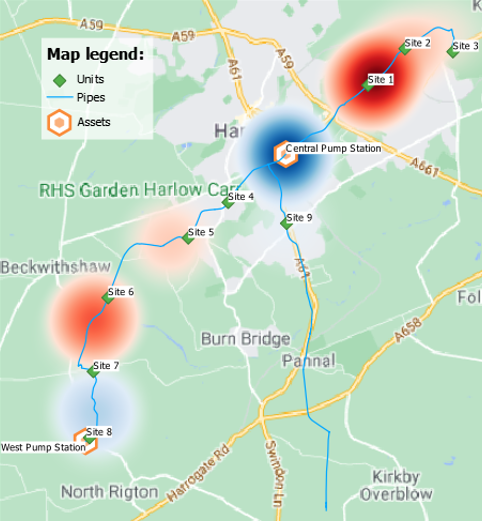
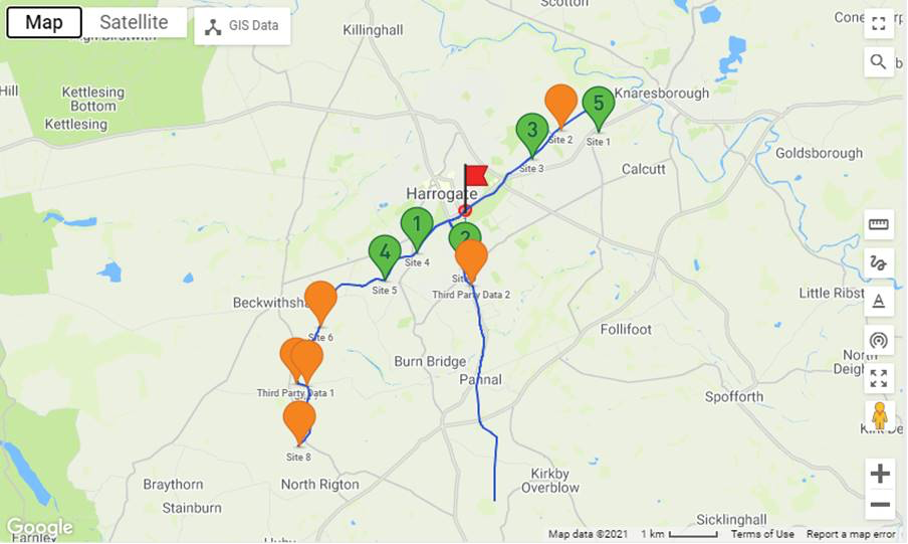
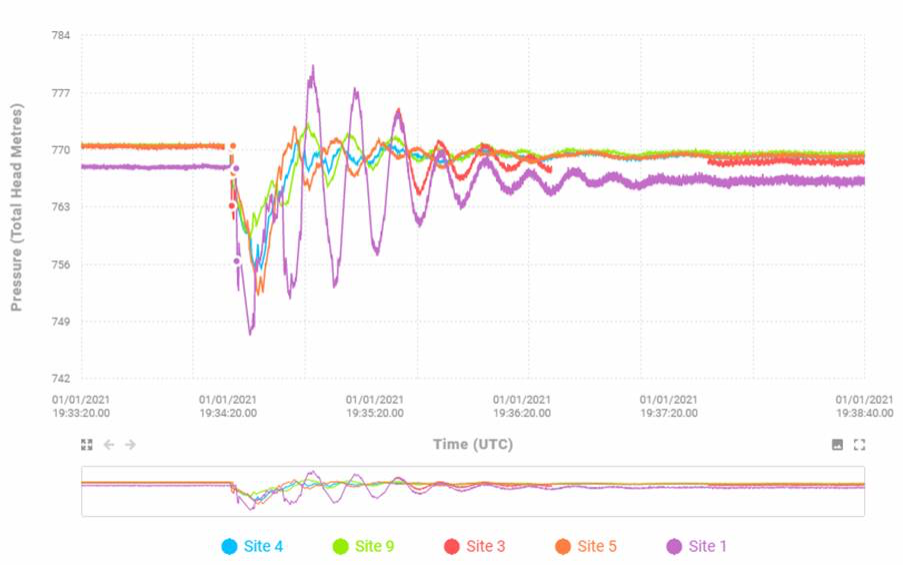
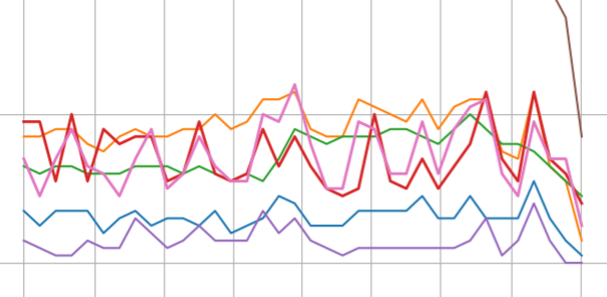
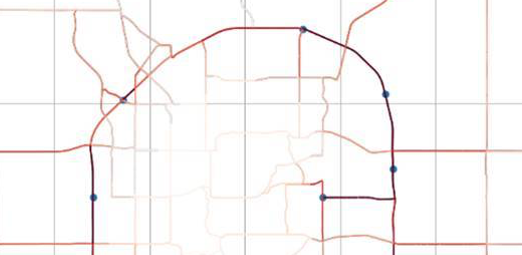
To demonstrate, the heat map shown in Figure 1 shows historic breaks in red and on-going triangulation results in blue for the fictional “Harrogate” RADAR Demo group. The heat map shows triangulation results are predominantly coming from the Central Pump Station with a few results coming from the West Pump Station. A sample of one of the triangulation results can be seen in Figure 2. Looking at the transient magnitude in Figure 3, it is quickly obvious that there’s a potentially causal link between the aggressive transients produced by the pump station and the breaks near Sites 1, 5, and 6. The powerful data provided by heat mapping gives the utility valuable and immediate insights to make operational changes to the network.
Understanding the underlying causes of events gives utilities the tools to remove those causes before they cause further asset degradation and costly leaks and bursts. High-resolution data is further enhanced with heat mapping that helps utilities quickly identify problems so they can prioritize network actions, either historic activity on the network or real-time data that can mitigate disasters.
To learn more about how your utility could benefit from Syrinix consultancy services, including heat mapping, contact us at info@syrinix.com.
Newly detected transient events are run through multiple levels of data analysis to identify and label features in the event data.
KPI modelling lets utilities identify and then confirm the effectiveness of operational changes
Deployment Planning allows utility engineers to optimize where units should be deployed