Gain a greater understanding of your network with our NEW offering.
Change country
RADAR, our cloud analysis platform allows for Scada data to be automatically imported straight from a Scada system. With this data, RADAR can analyse the pump run times as well as the off-time to create a pseudo flow into and out of the wet-well.
This pseudo flow is directly related to the actual flow and can be converted, with the addition of wet-well setpoints.
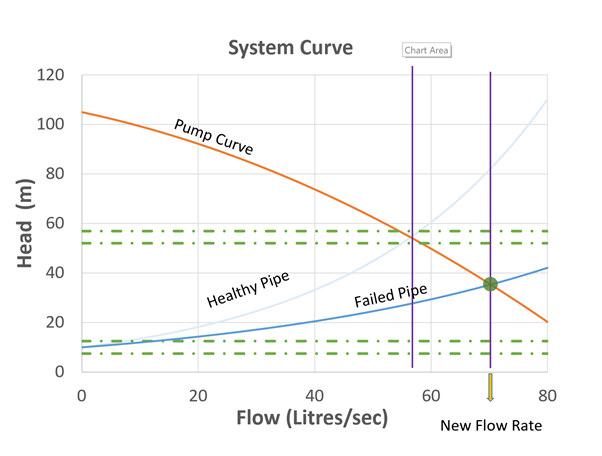
As shown by the graph, the flow through a main is dictated by the combination of the length, diameter and material of the main (the pipeline response curve) and the pressure/flow characteristics of the pump (Pump curve). If a main develops a hole, possibly due to a large break as shown in the figure, this causes the resistance to flow from the main to reduce and the pumps are then able to produce more flow for less pressure.
This increase in flow is seen in the pseudo flow and without a corresponding increase in flow into the wet well, this allows for a burst alert to be raised.