
City of Galveston
Case Study – City of Galveston uses PIPEMINDER-ONE pressure monitors to revitalise its system and improve resilience
Missouri American Water Company (MOAW) is a water utility company that serves approximately 1.5 million customers in the state of Missouri.
MOAW owns and operates a network serving St. Louis County, as well as portions of St. Charles and Jefferson Counties, through a piped distribution system of approximately 4,500 miles ranging from 2” to 42” in diameter.
These mains pump water at a pressure ranging from 30 psi to 200 psi gauge across 14 pressure gradients.
The project with Syrinix aimed to achieve an extended overview of network behaviour and to identify any problematic assets or operational issues via transient mitigation.

MOAW began with deploying transient loggers into the St. Louis County territory.
The project began with the selection of hardware, and planning the deployment of these units, backed up with regular analytical reports to implement any operational changes because of the insights provided.
Due to the large extension of St. Louis County, the area was divided into 50 KPI zones (network zone areas) to track the transient activity more accurately.
To determine the best places to deploy the transient loggers, Syrinix focused on the areas with the highest break density.
Break data was compiled, and a break heat map of the KPI zones was created. This allowed the identification of the most critical areas.
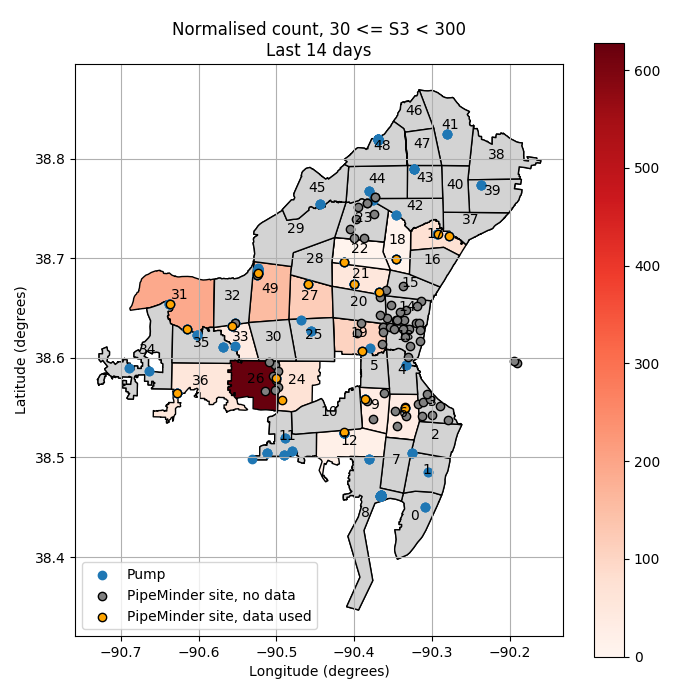
A total of 30 PIPEMINDER pressure loggers were allocated.
15 units were deployed in pump/booster stations through the entire length of the project, while the rest of the units were moved from zone to zone once enough information had been collected. The survey units remained in an area collecting information for 1 to 2 months on average, before being relocated.
The project’s reporting was delivered every 15 days, with immediate reporting if a significant event was detected.
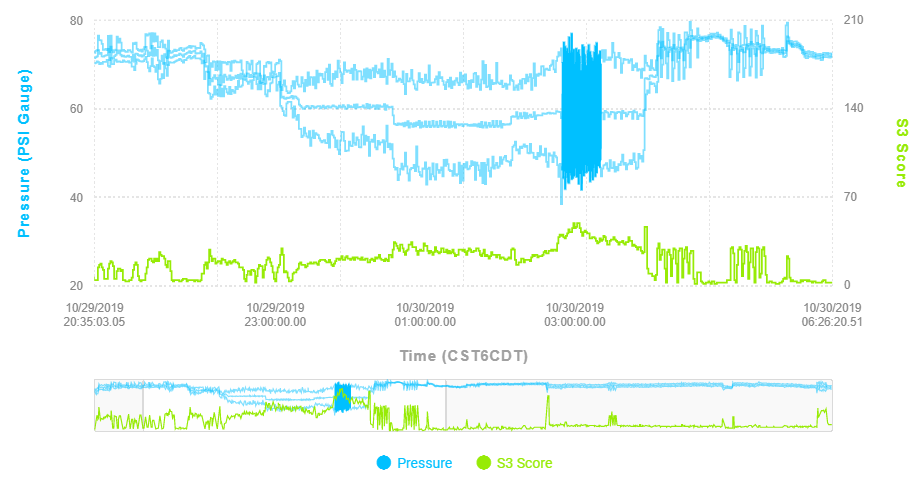
A PIPEMINDER logger deployed at a booster station began to detect transient events of considerable magnitude. The transient events occurred once pressure started to decrease smoothly and steadily, at which point a sharp spike in pressure was recorded by the transient logger.
An analysis of several of these pressure surges revealed that the event comprises up to 121 PSI of difference between the highest crest and the lowest trough, in less than a second, and that occurred roughly at 10 p.m. CDT.
This indicated that the transient spike could be generated by an operational scheduled event. To identify the source of the event, Syrinix imported SCADA data and compared the times and dates of
the transient events to the known operational events on the network.
![]()
The second period of the analysis revealed a hot spot of longitudinal breaks in a different area of the St. Louis County territory. An observation of the KPIs showed that high transient activity in the area.
Pressure transient information collected by the units revealed a sustained oscillation captured by several units in the area.
Data from the transient logger at the pumping building nearby revealed regular periods of prolonged pressure oscillations with an amplitude of 32.5 PSI and a frequency of 22Hz.
Like the valve closure event detected at the pump station, Syrinix imported SCADA data and looked for correlations. This time, the event did not happen in a short time but rather lasted for several minutes.
This could indicate that the event was generated by a valve operation. SCADA data for valves was again plotted in parallel to the pressure oscillations detected by the PIPEMINDER device.
At the end of the project, after joint further investigations which resulted in a study of the plans for the pump building, it was observed that the opening percentage of a butterfly pressure sustaining valve matched with the times the oscillation was observed.
The oscillations were likely generated due to a faulty PSV at the pump station, which oscillated when regulating the pressure at the pipe.
In a final example, a review of pressure data on one specific area revealed a recurrent drop that reached up to 15 PSI in range and propagated through most of the survey sites across that area.
The high sample rate data were used to triangulate the source of the event. The result of the triangulation was located close to a pump station in one of the surveyed zones.
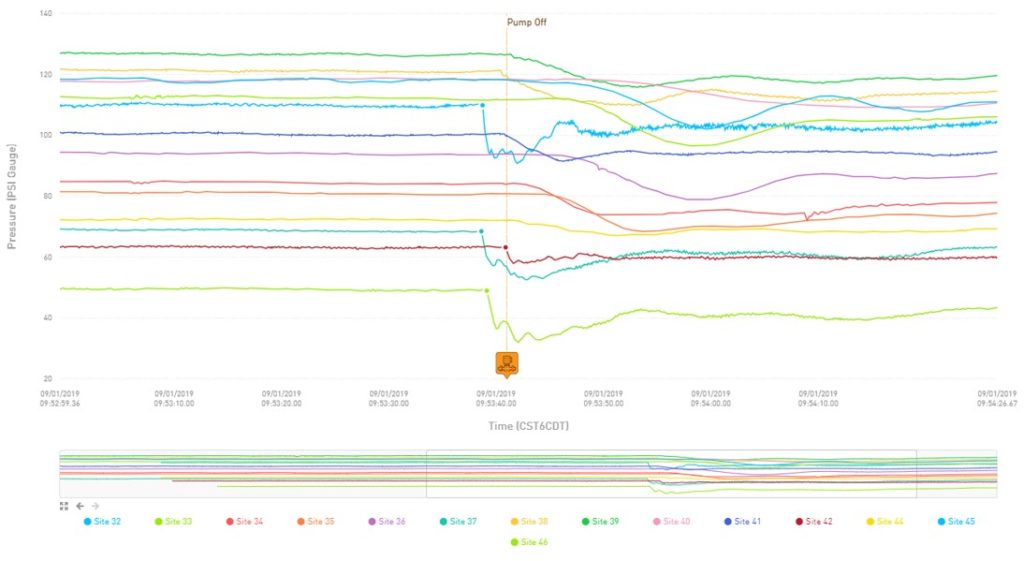
SCADA data was overlayed on top of the pressure data showing that one of the pumps at the pump station was turned off, creating a transient event that was detected in the surrounding area.
Case Study – City of Galveston uses PIPEMINDER-ONE pressure monitors to revitalise its system and improve resilience

Optimizing Pressure Transient Monitoring With Data-Driven Monitor Placement.