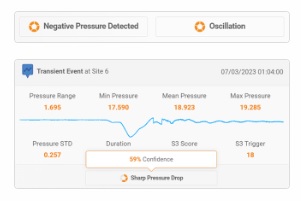
Automated Transient Labelling
Newly detected transient events are run through multiple levels of data analysis to identify features in the event data.

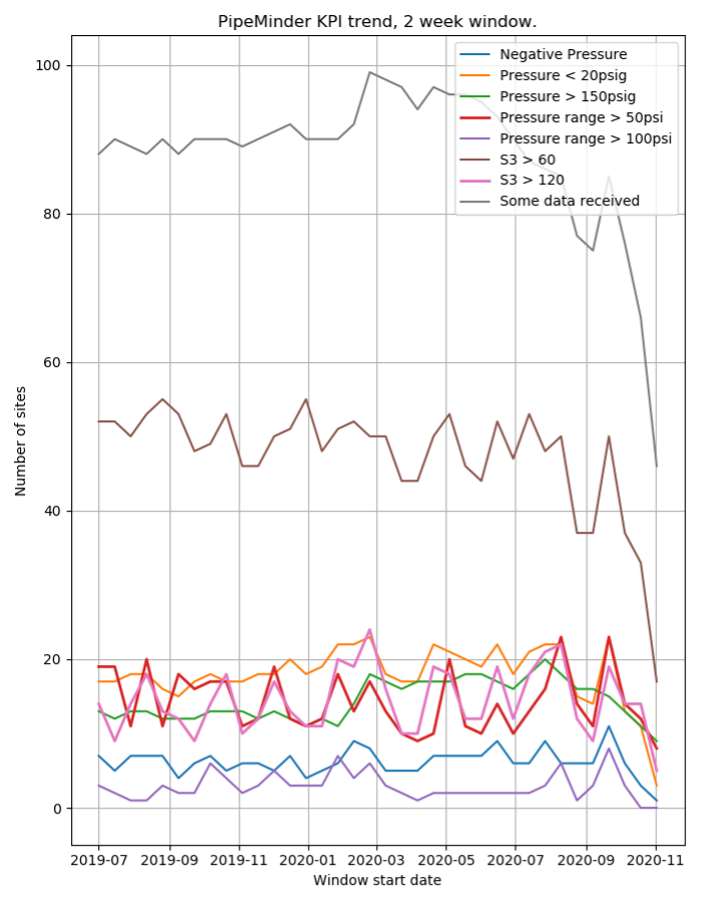
Key Performance Indicators (KPI) are performance measures used to evaluate and determine the progress and accomplishment of particular activities. For water utilities, key performance indicators (KPIs) can refer to a set of measures used to gauge the overall long-term performance of their water distribution system.
As part of a consultancy program, Syrinix can implement KPIs to evaluate the data that is collected by a client’s PIPEMINDER pressure monitors and evaluate network activity. KPIs specifically help determine acceptable limits of high and low pressure compared to those of other assets in the utility and to assess the presence of damaging pressure events using the Syrinix S3 score. The utility can prioritize deployment sites based on historic leak/burst occurrences, the criticality of the asset, thresholds for high-pressure transients, and negative pressure sites. Using these matrices, the utility can see if the operational changes they are making, based on the high-resolution data collected, to “calm the network” are working.
Based on the client’s intended goals, KPIs are set at the beginning of each project. Syrinix KPIs are divided into two levels: group-level KPIs and site-level KPIs.
Newly detected transient events are run through multiple levels of data analysis to identify features in the event data.
Learn how S3 – Syrinix’s non-dimensional measure of pressure transients can help understand what is happening on a water network
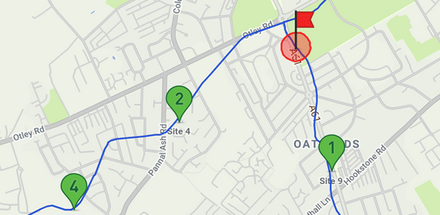
Watch our NEW video highlighting how Triangulation can locate the source of harmful network events.