Heat Mapping Mitigates Calamity
Heat mapping helps utilities quickly identify problems so they can prioritize network action
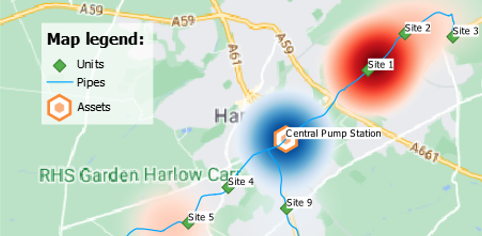
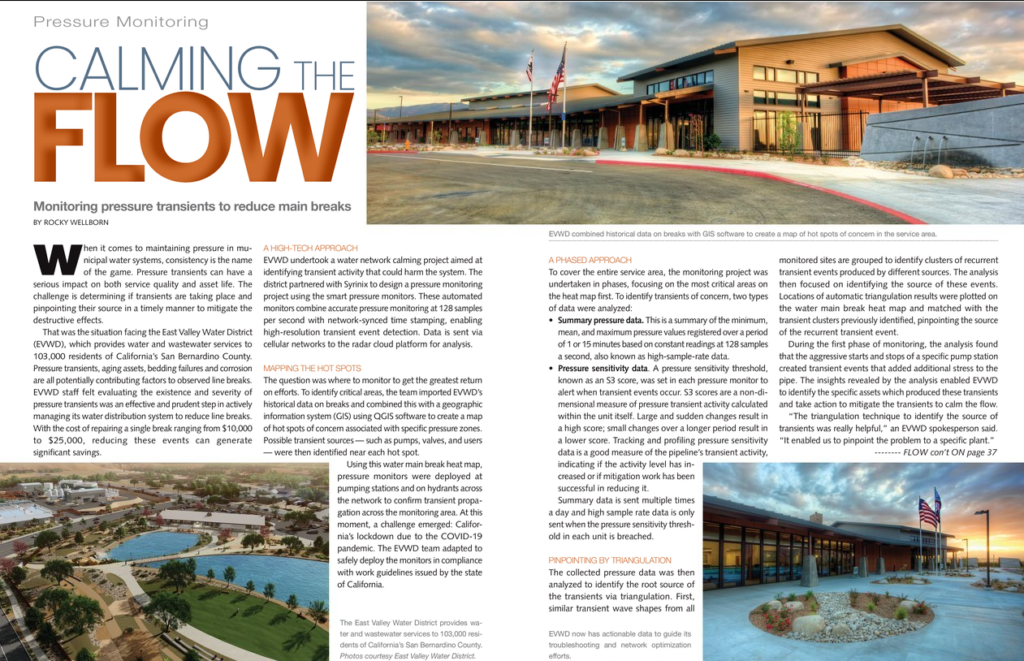
East Valley Water District (EVWD), in conjunction with Syrinix, began a monitoring project in San Bernardino, CA to identify and mitigate regular transients resulting from daily operations, which could be harmful to the network.
The captured pressure data was analyzed using methods such as grouping – or clustering - of transients by their waveshapes and also heatmaps of automatic triangulations.
This analysis resulted in the identification of different transient events and their possible source.
After a deeper investigation done by the water utility, EVWD identified the specific troublesome assets and their failures and worked to replace them.
Heat mapping helps utilities quickly identify problems so they can prioritize network action
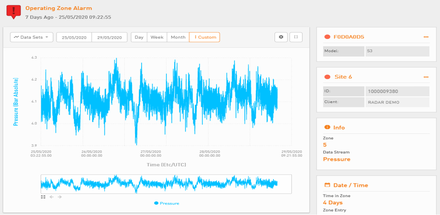
Syrinix has developed an intelligent low-pressure alarm notification to alert when minimum pressures breach
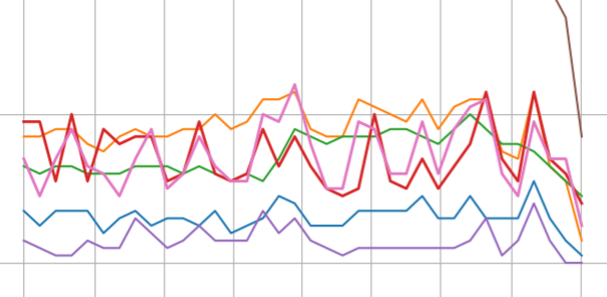
KPI modelling lets utilities identify and then confirm the effectiveness of operational changes