Could a programme of transient monitoring feed a more targeted operational response?
Change country
Evides is a Dutch utility providing drinking water to 2.5 million household and business customers in Zeeland, in the southwest of The Netherlands.
The utility met with Syrinix to discuss how a pressure monitoring project could be implemented, with a clear objective to discover if transient monitoring could be used not only to locate and detect bursts but feed a targeted operational response.
The project began with the selection of monitoring sites using the Syrinix deployment planning tool, which estimates the transient monitoring coverage achieved by a set of proposed deployment locations

The tool predicts the network response (reported transient amplitudes) to a set of simulated events, which gives the client an indication of the range of events that will be captured given the proposed installation sites.
This allows the selection of installation sites to be refined to give the level of coverage required by the client.
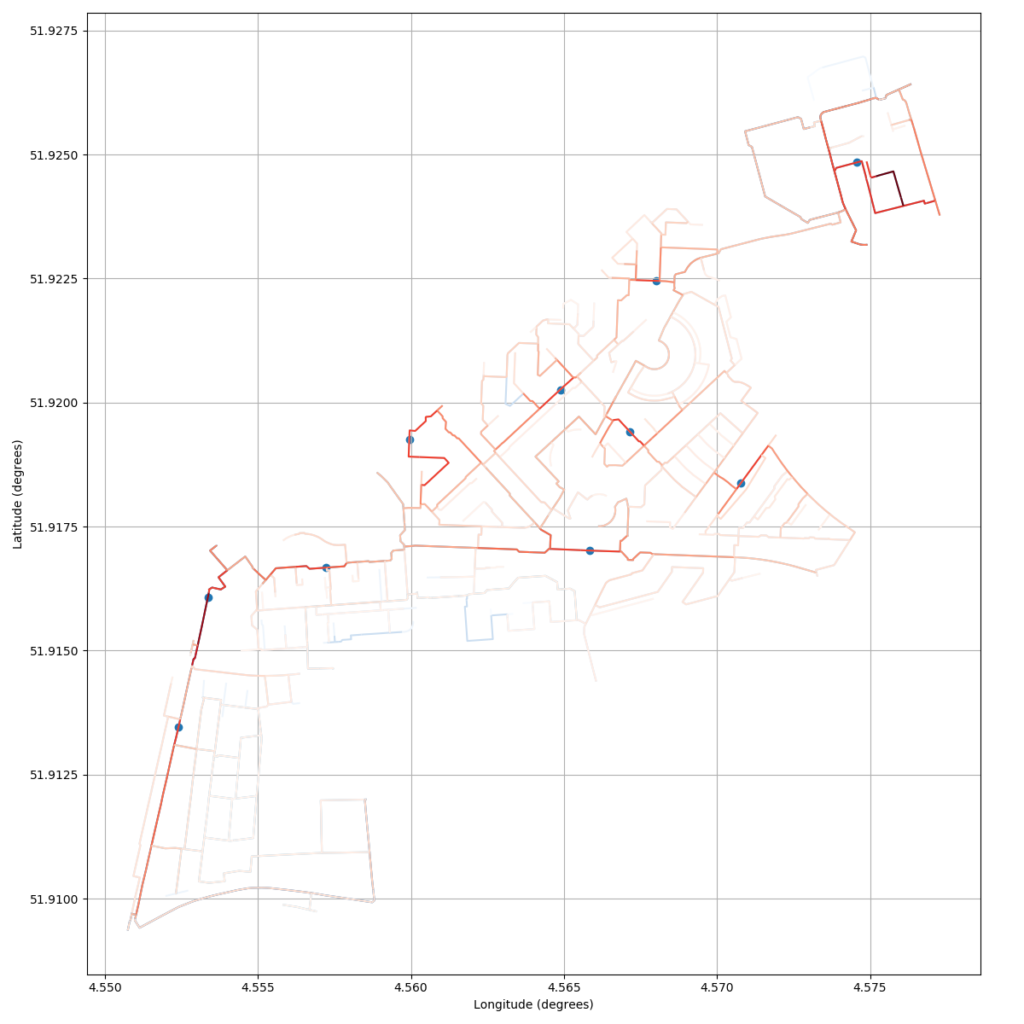
A typical output from the planning tool is shown in Figure 1. The blue dots show the sensor deployment positions, bold red, shows areas covered with pale red indicating areas where transient waves decay and become less visible.
The predictions for what can be seen by each monitor take into consideration the source event magnitude, pipe material, pipe diameter and network topology
Following deployment within the district metered area (DMA), events of varying amplitude were simulated at multiple hydrant locations by introducing a fast flow change.
The pressure wave from a simulated burst travels around the DMA and is detected by multiple time synchronised PIPEMINDER devices (each automatically kept within +/-50ms of each other). Each one detects the event using its S3 scoring algorithm and immediately transmits high sample rate data over the cellular network to RADAR, Syrinix’s cloud-based data analytics platform.
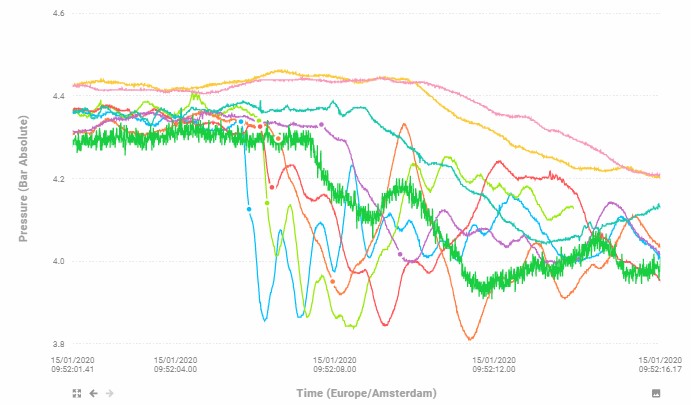
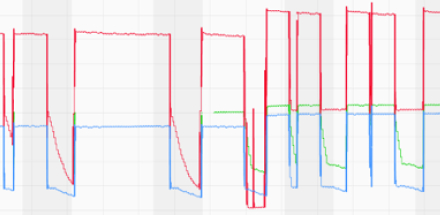
RADAR automatically analyses the data from each of the multiple sensors and determines the exact onset of the pressure wave at each monitor (see Figure 2 below). Onsets from multiple sites are then grouped together into an event and the event source location calculated using Syrinix’s triangulation algorithm.
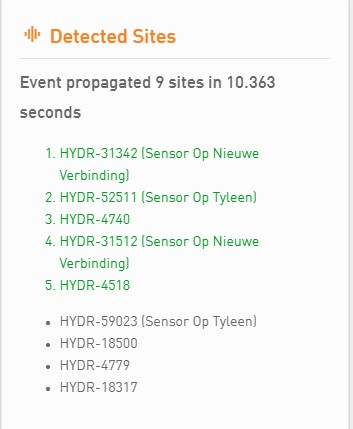
In this example the simulated burst event was detected by the nine monitors marked as green on the map (Figure 3), the table indicates the order of arrival time. Data from the monitors numbered 1 to 5 was used to triangulate the position of the burst.
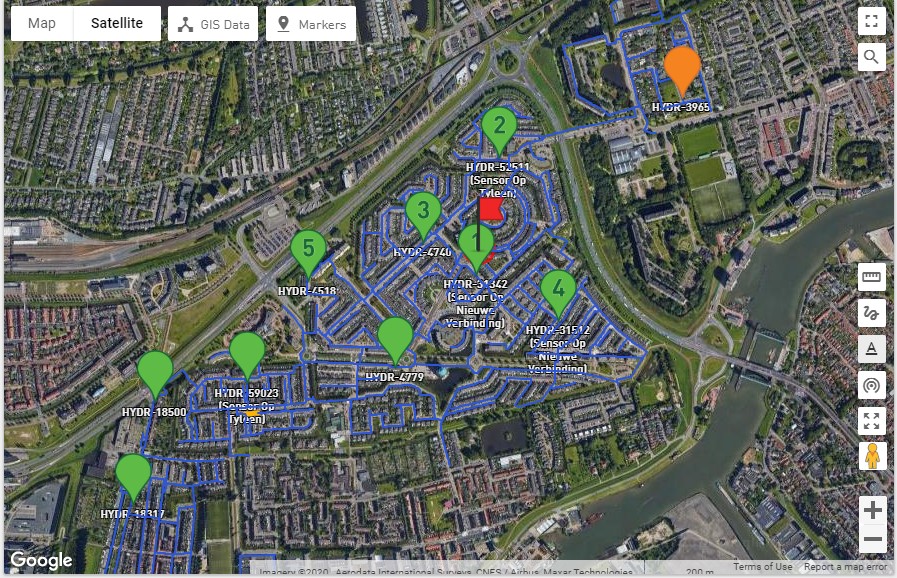
The enlarged image (Figure 4) details the triangulated position of the event, shown with the red flag.
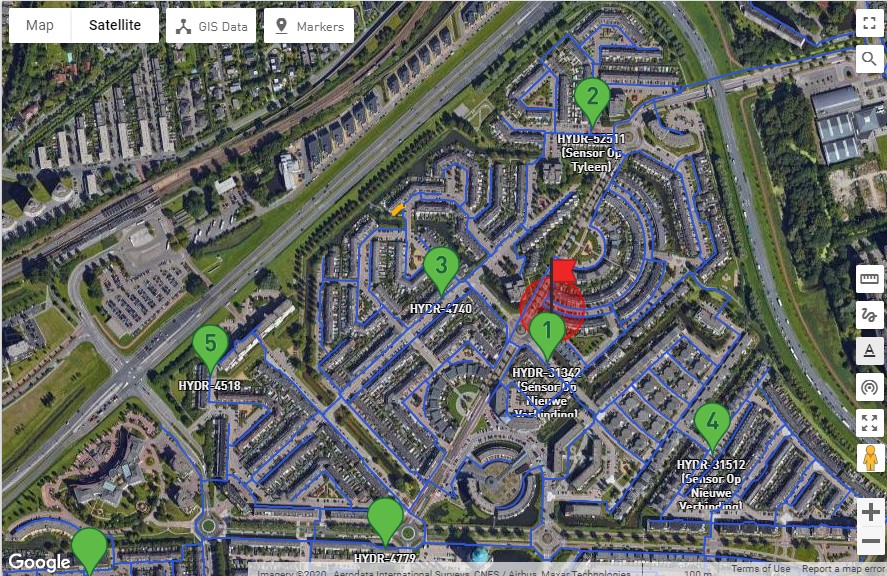
This automated result was calculated and notified in RADAR in under five minutes of the event occurring, with the result predicted only 80m from the true location.
The features and flexibility of RADAR allows engineers to analyse the event and edit the pressure wave onsets if their expert knowledge suggests the automated analysis could be improved.
In this instance, the ability to quickly review and re-process the event improved the position of the triangulation to within 42m of the true location.
Given the size and complexity of the network, this is a very good result and places the response team close to the burst.
Anglian Water carry out transient studies within their innovation hub ‘Shop Window’
Data Helps to Solve Contra Costa Water District’s Water Pressure Spike Mystery